This article will introduce how to analyze the optical system, such as to show a visual representation of the system, and then focuses on the Spot Diagram, OPD Fan and Ray Fan analyses, to evaluate the system aberrations.
| Analysis | Description |
| Layout | A layout may be opened by navigating to Analyze…System Viewer…Cross-Section. The Cross-Section option plots a YZ cross section through the lens, and is only valid for rotationally symmetric, axial systems. A layout diagram is always a useful visual representation of the current optical system. |
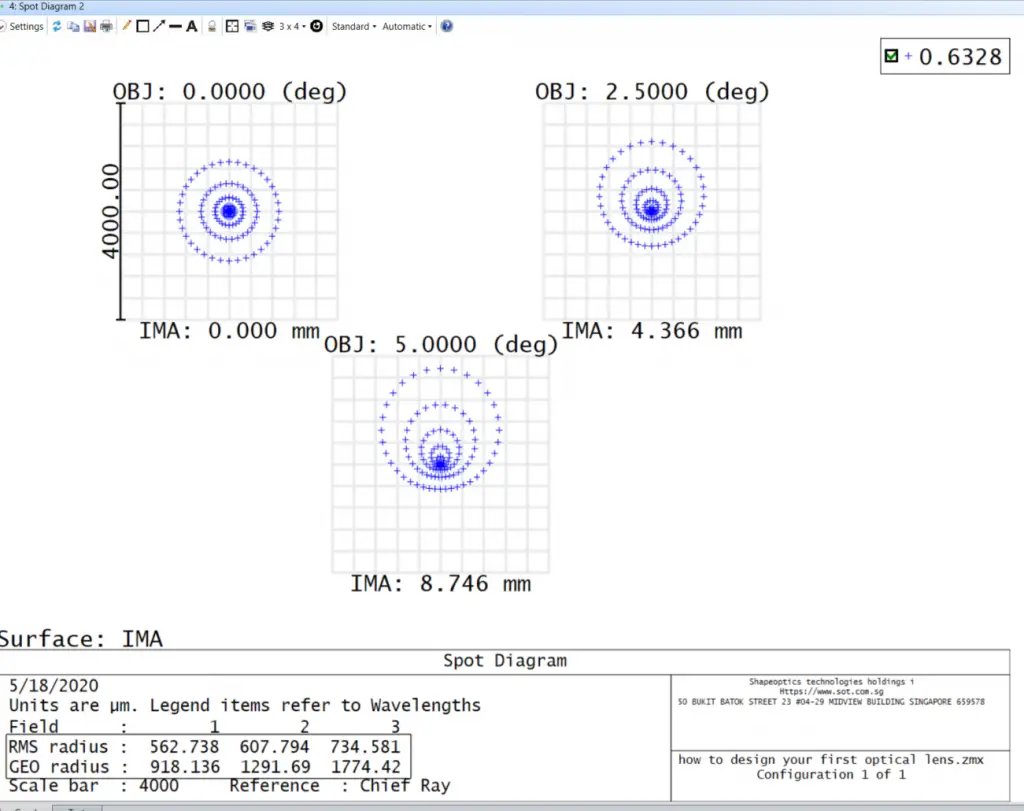
| Spot Diagram | A spot diagram may be accessed by navigating to Analyze…Spot Image Quality…Rays & Spots…Standard Spot Diagram. The spot diagram gives indication of the image of a point object. In the absence of aberrations, a point object will converge to a perfect image point. By default, OpticStudio plots the spot diagram for each field point. |
| OPD Fan | The Optical Path Difference (OPD) fan can be opened by selecting Analyze…Image Quality…Aberrations…Optical Path. The OPD fan is a plot of the optical path difference as a function of pupil coordinate. In a perfect optical system, the optical path of the wavefront will be identical to that of an aberration-free spherical wavefront in the exit pupil. |
| Ray Fan | The Ray Fan plot in OpticStudio may be opened by selecting Analyze…Image Quality…Aberrations…Rays Aberration. The Ray Fan plots ray aberrations as a function of pupil coordinate. Generally, a given ray which passes through the optical system an onto the image surface, its point of intersection falls on some small but nonzero distance away from the chief ray. Once again, in a perfect optical system, the ray aberrations should be zero across the pupil. |


From evaluation of the four plots above, it is obvious that the singlet design has a significant number of aberrations, including but not limited to spherical, coma, distortion, defocus, field curvature, and astigmatism. In addition, the geometrical and RMS radii (as is reported at the bottom of the Spot Diagram) at the maximum field are roughly 734 and 1774 μm, respectively:

Reference Source: https://www.zemax.com/