In optical system design, analyzing aberrations is crucial for ensuring image quality. In this article, we will introduce methods for analyzing an optical system, including visual representation through the Spot Diagram, OPD Fan, and Ray Fan plots. These analyses help evaluate system aberrations and assess overall optical performance.
Analysis Tools
1. Layout
To visualize the current optical system, navigate to Analyze…System Viewer…Cross-Section. The Cross-Section option plots a YZ cross-section through the lens, which is only applicable for rotationally symmetric axial systems. This layout diagram provides a useful visual representation of the optical system, helping to understand the overall structure.
2. Spot Diagram
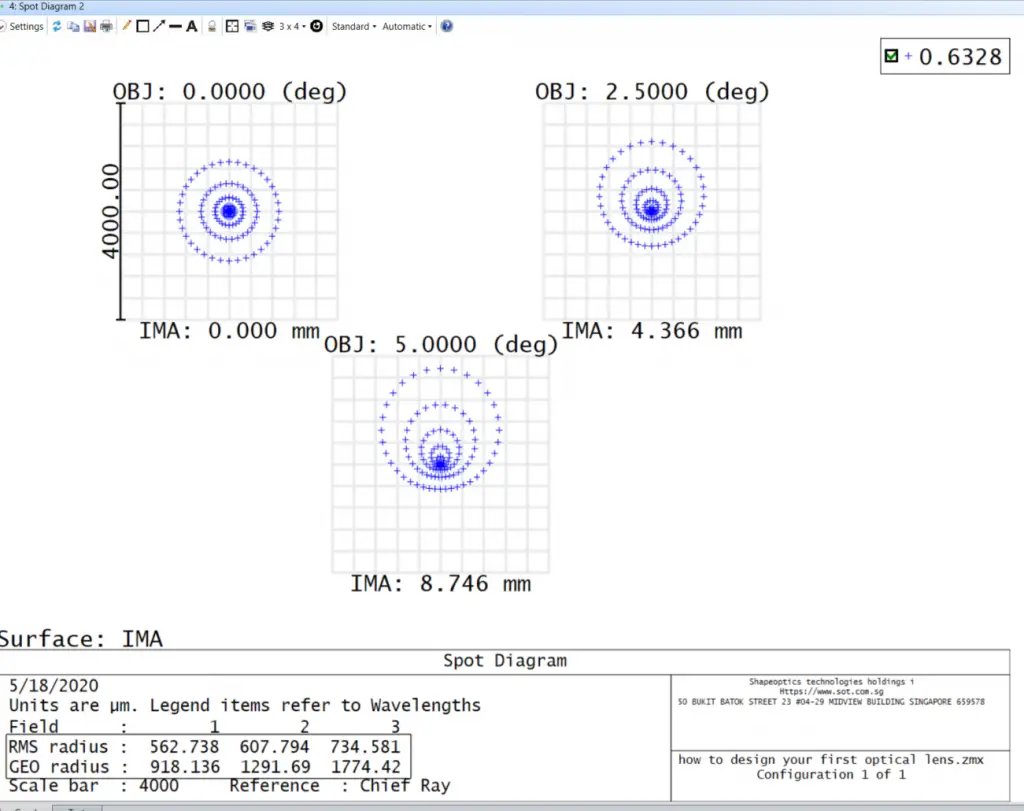
The Spot Diagram provides a visualization of the image formed from a point object. To access it, navigate to Analyze…Spot Image Quality…Rays & Spots…Standard Spot Diagram. In an ideal system with no aberrations, a point object should converge to a perfect image point. The Spot Diagram in OpticStudio is plotted for each field point by default, offering insight into image quality across the system.
3. OPD Fan
The Optical Path Difference (OPD) Fan plot is accessible via Analyze…Image Quality…Aberrations…Optical Path. This plot shows the optical path difference as a function of pupil coordinate. In a perfect optical system, the optical path of the wavefront matches that of an aberration-free spherical wavefront in the exit pupil. This analysis helps identify variations in path length, which can indicate aberrations in the system.
4. Ray Fan
To view Ray Aberrations, select Analyze…Image Quality…Aberrations…Rays Aberration. The Ray Fan plot shows ray aberrations as a function of pupil coordinate. Ideally, a ray passing through the optical system should intersect the image surface at the same point as the chief ray, resulting in zero aberrations. Any deviation indicates the presence of optical errors.


Evaluating Aberrations: An Example
In the case of a singlet lens design, analysis reveals several aberrations, including:
- Spherical Aberration
- Coma
- Distortion
- Defocus
- Field Curvature
- Astigmatism
From the Spot Diagram, the geometrical and RMS radii at the maximum field are found to be 734 μm and 1774 μm, respectively, indicating the extent of aberrations at the edges of the field.
