Converting slope error to wavefront Peak-to-Valley (PV) error involves understanding the geometric relationship between the surface slope errors and the resulting wavefront errors in optical systems. Here’s a detailed guide to perform this conversion:
1. Understand Slope Error
- Slope Error: The angular deviation of the surface normals from the ideal shape, usually given in microradians (µrad) or arcseconds.
2. Wavefront Error Basics
- Wavefront Error: The deviation of an actual wavefront from an ideal wavefront, measured in units of wavelength or nanometers.
3. Relationship Between Surface and Wavefront Errors
In an optical system, the surface errors of optical elements contribute to the wavefront errors. For reflective surfaces (mirrors), the wavefront error is typically twice the surface error due to the reflection process. For transmissive surfaces (lenses), the relationship depends on the lens geometry.
4. Conversion Steps for Reflective Surfaces (Mirrors)
- Determine the Slope Error: Convert the slope error from microradians (µrad) to radians if necessary. Slope Error (radians)=Slope Error (µrad)×10−6
- Relate Slope Error to Surface PV Error: The PV error on the surface can be derived from the slope error by integrating over the aperture. For small angles, the surface PV error is approximately: Surface PV Error≈Slope Error (radians)×D where D is the diameter of the optical aperture.
- Convert Surface PV Error to Wavefront PV Error: For mirrors, the wavefront error is approximately twice the surface error: Wavefront PV Error≈2×Surface PV Error
Example Calculation
Given:
- Surface slope error: 200 µrad
- Diameter of the optical aperture (DDD): 75 mm
- Measurement Wavelength (λ\lambdaλ): 0.632 µm
Conversion Steps:
- Convert the Slope Error to Radians: Slope Error (radians)=200×10−6=2×10⁻⁴ radians
- Relate Slope Error to Surface PV Error:
- The PV error on the surface can be derived from the slope error by considering the geometry of the optical surface. The surface PV error is approximately: Surface PV Error≈Slope Error (radians)×D
- Here, D=75 mm=0.075 meters Surface PV Error≈2×10−4×0.075=1.5×10⁻⁵ meters=15 micrometers
- Convert Surface PV Error to Wavefront PV Error:
- For mirrors, the wavefront PV error is typically twice the surface PV error: Wavefront PV Error≈2×Surface PV Error=2×15 micrometers=30 micrometers
- Convert Wavefront PV Error to Wavelengths:

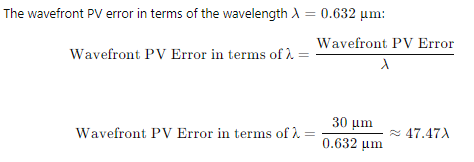
Given a surface slope error requirement of 200 µrad and an aperture diameter of 75 mm, with a wavelength of 0.632 µm (as measured by a Zygo interferometer), the wavefront PV error is approximately 47.47 wavelengths (λ).
Summary
To convert slope error to wavefront PV error for mirrors:
- Convert the slope error to radians.
- Multiply the slope error by the diameter of the optical aperture to get the surface PV error.
- Multiply the surface PV error by 2 to get the wavefront PV error.
For Transmissive Surfaces (Lenses)
For lenses, the conversion is more complex and depends on the lens design. A detailed optical analysis or ray tracing is required to accurately relate surface slope errors to wavefront errors. If you need more info, please look for shape Optics Technical support