In this article, using the laser diode collimation simulation example, we will show how to enable ME engineer to detect errors early, reduce back-and-forth communication by delivering analysis tools that show the impact on optical performance.

Before simulating the laser diode collimation optical system, the system settings window should be opened by clicking on System Settings in the Command Manager.

Selecting the Precision settings tab allows the number of rays to be set for a ray trace. We suggest that 10,000 rays be used for a high level ray trace, with more rays being used as the design is refined.

Enabling scattering enables the scatter profile for each surface. When scattering is disabled all surfaces have mirror surface finishes.
Enabling ray splitting causes scattered, reflected, and transmitted rays to split off from a parent ray when hitting optical or opto-mechanical surfaces. This more accurately models the flow of energy in the optical model while increasing ray trace time as the number of rays traced grows.

These settings affect:
- How many times a ray may split and/or intersect with surfaces before being clipped
- Maximum number of source rays to commit to memory
- The relative and absolute ray intensity cutoff before being clipped
- The spacing between cemented lenses
- How far to draw rays after they miss all geometry before being clipped
Changing NSC ray trace settings can dramatically affect simulation times. Increasing the number of intersections or segments rays may have causes rays to be traced through more beam paths as rays scatter off surfaces or are split through ray splitting. Decreasing the minimum relative or absolute ray intensity values causes rays to be traced longer before meeting the minimum intensity criteria before being clipped.

After running the simulation of laser diode collimation, the results window is displayed at the end of a successful simulation.
If a performance metric is greater than its allowable value it is highlighted in red in the results table. Any performance metric in white may be clicked to display the metric value instead of a green checkmark.
Detectors may be viewed by selecting Show Detectors in the results table.

For each detector field and configuration the RMS spot size, number of hits by rays, peak irradiance, and throughput (total power on detector) are displayed.
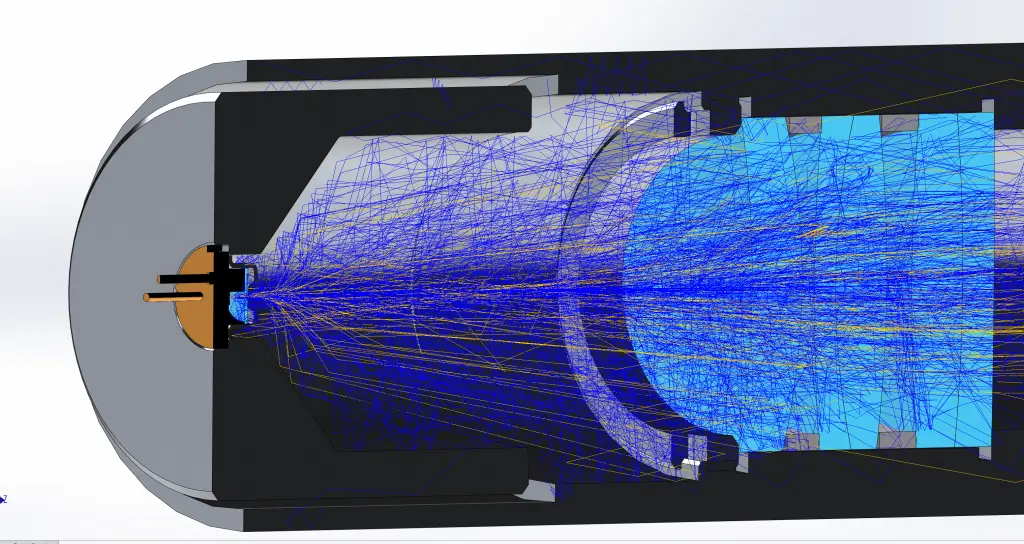
Selecting Show Clipped Rays or Show Contaminating Rays in the results table will plot rays that never strike a detector or rays that strike an unintended detector, respectively. Plotting the clipped ray set is useful for determining which mechanical component(s) is blocking rays.

In this laser diode collimation case, the clipped ray set indicates that the annulus in the center assembly is clipping rays. Editing the annulus to increase its inner diameter improves image quality and reduces beam clipping.
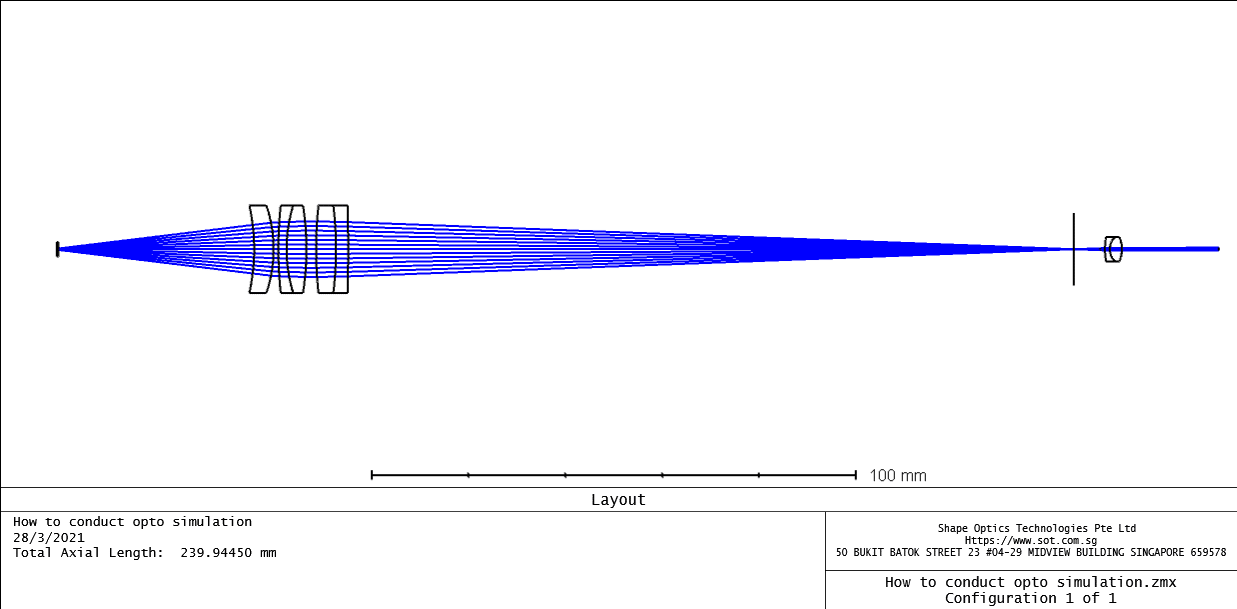
The design file used in this particle is attached, please download it here. How to conduct opto simulation
Reference Source:
- Laikin, Milton. Lens Design. CRC Press, 2007.
- https://www.zemax.com/
- Zemax Optical Design Program User’s Guide, Zemax Development Corporation
- https://en.wikipedia.org/wiki/Main_Page