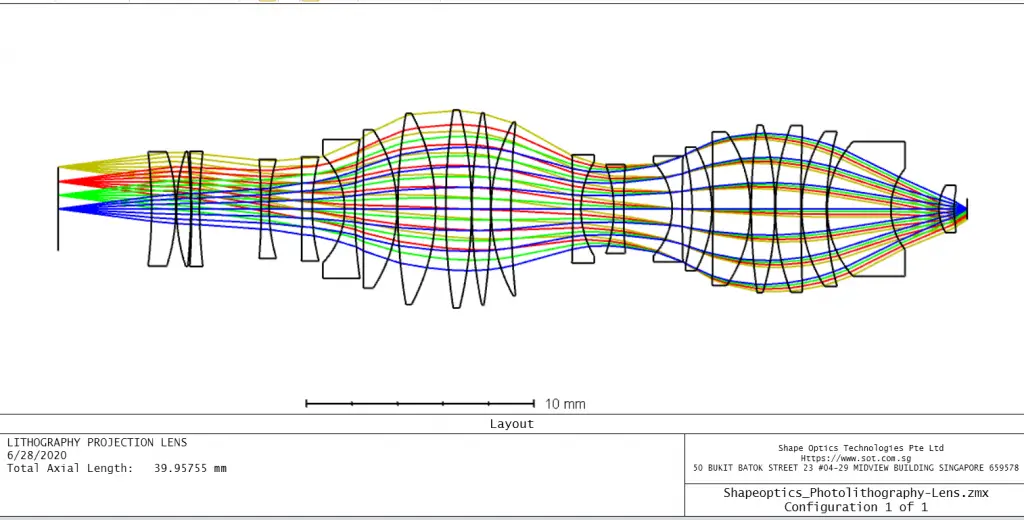
A partially coherent imaging system is more complex than incoherent or coherent because each point on the source will have a different level of coherence with respect to each other source point. The degree of coherence between points is dependent upon a parametric function. In general, the closer two points are, the more coherent that they will be. Partially coherent transfer functions are appropriate for many real-world sources. For example, in photolithographic applications, the typical sources used are not fully coherent. The effect of partial coherence on the imaging of a mark onto a wafer is very important.
Here is the example how to analyze partial coherent imaging.

The coherence function between two signals x(t) and y(t) is defined as

The coherence varies in the interval [0,1] . If gamma ^{2}=1 it means that the signals are perfectly correlated or linearly related and if gamma ^{2}==0. they are totally uncorrelated.
In the partial coherent imaging system, there are two computation methods available, Mostly Coherent and Mostly Incoherent. The method that you should use depends upon how broad the Gamma function that you are using is.
In Zemax, , it is always important to visualize the Gamma function that you are using, as described on the previous page, to determine which computation method you should use. In summary:
|
Use Mostly Incoherent method when: |
Use Mostly Coherent method when: |
|
“Alpha” is small |
“Alpha” is large |
|
Gamma is narrow (comprises < 20% of image) |
Gamma is broad (comprises > 20% of image) |
Both the Mostly Incoherent and Mostly Coherent methods speed up the Partially Coherent Image Analysis computations by making the assumption that the Gamma function has a finite width.
About the Partially Coherent Image Analysis
This feature considers diffraction and aberrations of the optical system, as well as partial coherence of the illumination, to compute the image appearance. This method accounts for the finite pass band and other diffraction related effects real optical systems have on image formation. This feature can compute the coherent, incoherent, or partially coherent diffraction image of scene defined by a bitmap image.
Open the settings for the Partially Coherent Image Analysis window and change “Data Type” to Raw Image (no diffraction). This displays the source that we are going to image through the photolithographic lens, a F target.

Next, we are going to look at 3 cases, a fully incoherent image of this source, a fully incoherent image, a fully coherent image and a partial coherent image.
A fully coherent image:


The resulting image shows the general blurring expected (as a result of diffraction) but no coherent interference.
A fully coherent image


The resulting image shows the general blurring expected (as a result of diffraction) but with coherent interference.
A partial coherent image
Before analyze the partial coherent images, check the Gamma factor first:


From the display, it is clear that the Gamma function covers more than 20% of our image, so we will still use the Mostly Coherent method here.

Not all light sources are perfectly incoherent or perfectly coherent. Some light sources lie somewhere in the middle as a partially coherent source. Using Partially Coherent Image Analysis, images of partially coherent sources can be generated. Here this article will help you.
Reference Source:
- https://www.zemax.com/
- Zemax Optical Design Program User’s Guide, Zemax Development Corporation
- https://en.wikipedia.org/wiki/Main_Page